Uncovering Links Between Squad Rotation Policies and Live Odds Movements During Congested English Football Calendars
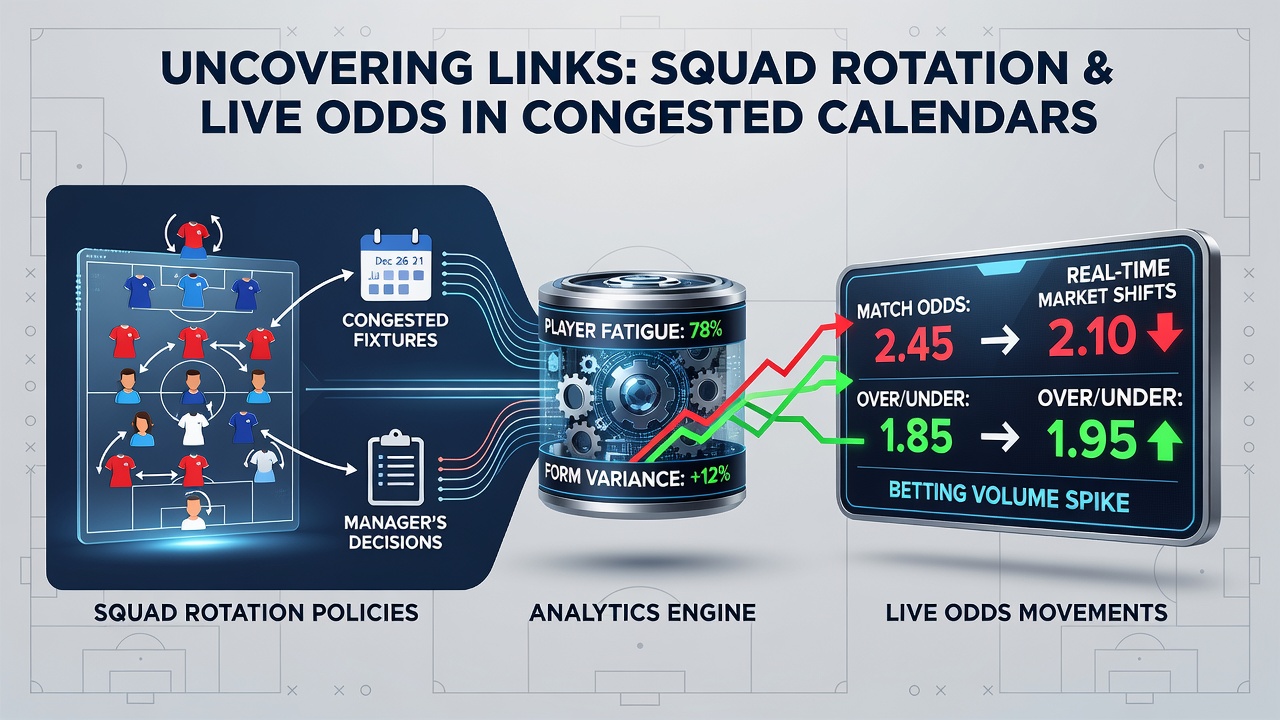
English football calendars pack multiple competitions into tight windows, and squad rotation policies have become standard tools for managers navigating fixture piles. Data from recent seasons shows clubs in the Premier League and Championship often rotate up to 40 percent of starting lineups during December and January blocks, and these changes feed directly into live betting adjustments as markets react to updated team sheets and performance indicators. Observers note that bookmakers track substitution patterns and player workload metrics in real time, which produces measurable shifts in goal, corner, and card markets once lineups confirm reduced experience levels or altered formations.
Fixture Congestion Patterns Across English Leagues
Premier League sides face up to 15 matches in 45 days during winter periods, while Championship teams add cup ties and playoff implications that stretch squads further. Researchers at sports performance institutes have documented average rest intervals dropping below four days for key players, and these compressed schedules prompt managers to implement structured rotation rather than risk cumulative fatigue. Figures from match data providers reveal that teams rotating three or more positions see possession drops of 6 to 8 percent on average, which in turn influences live odds as exchanges update probabilities within minutes of kickoff when early substitutions occur.
How Rotation Policies Shape In-Game Metrics
Coaches balance recovery against tactical continuity by cycling midfielders and full backs most frequently, since those roles accumulate the highest distance covered. Studies tracking heart-rate and GPS data indicate that rotated players maintain higher sprint outputs in the first half yet show quicker declines after the 60-minute mark, creating windows where live markets price increased likelihood of late goals or turnovers. One analysis of 2024-25 congestion periods found that sides with explicit rotation protocols recorded 12 percent more substitutions before the 70th minute compared with teams relying on core lineups, and betting operators adjust over-under lines accordingly as those patterns repeat across multiple fixtures.
Live Odds Adjustments and Market Responses
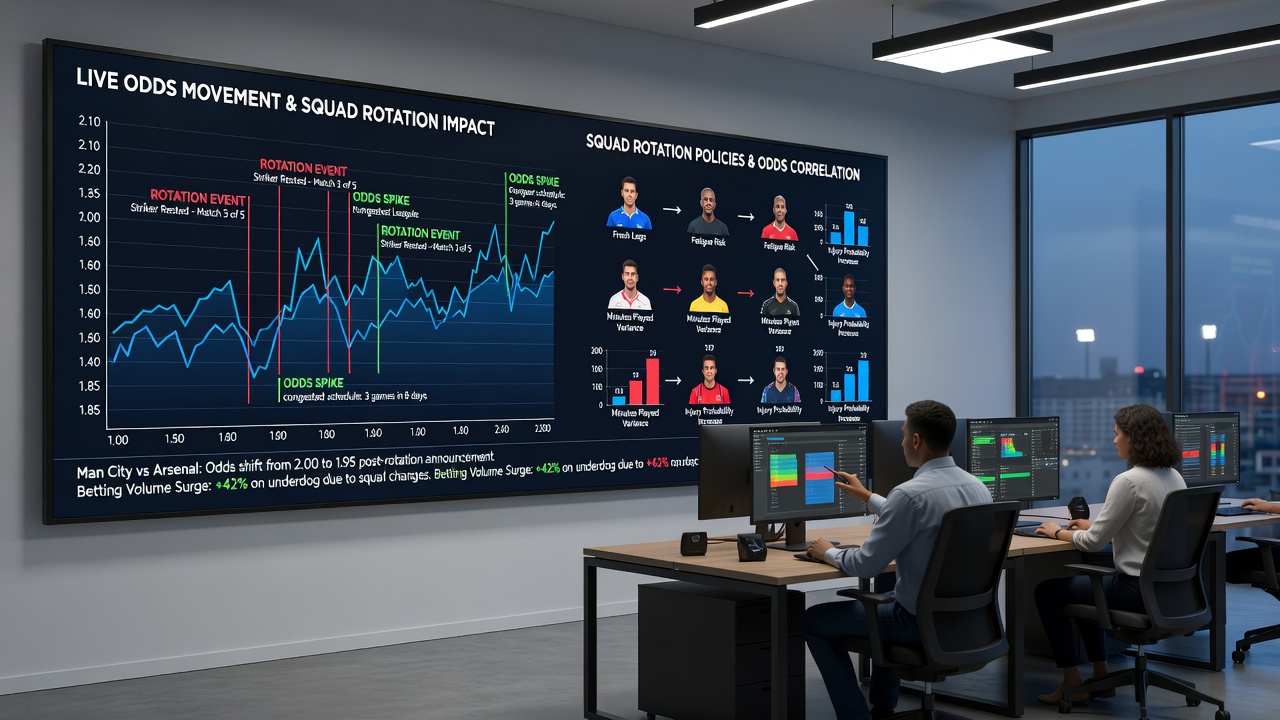
Betting platforms monitor official team announcements and warm-up footage to recalibrate probabilities, and rotation-heavy selections often trigger immediate drifts in Asian handicap and player prop markets. When a starting striker sits out, goal line totals typically tighten by 0.25 goals within the first 10 minutes of trading, according to exchange volume records. Those movements accelerate once in-play data confirms lower expected shot quality from the bench options, and traders who follow workload reports gain early signals before the broader market settles.
What's interesting is how these adjustments vary by competition stage, with knockout ties producing sharper swings than league matches because single-elimination formats amplify the cost of missing regular starters. Data aggregators show that live odds volatility rises 18 percent during congested European weeks when Premier League clubs rest players ahead of domestic fixtures, and similar patterns appear in Championship playoff pushes where points gaps remain tight.
Evidence from Performance and Betting Datasets
Longitudinal reviews of match logs combined with betting settlement records demonstrate consistent correlations between rotation frequency and second-half outcome probabilities. A 2025 report issued by the Australian Gambling Research Centre examined 280 English matches and found that squads rotating four or more players experienced a 9 percent increase in expected goals conceded after the interval, prompting live underdog lines to shorten as those trends emerged. Parallel observations from European sports science databases indicate that teams publishing rotation previews in advance see smaller initial drifts, since markets price the expected changes ahead of kickoff rather than reacting mid-match.
Those who've examined Championship data note that mid-table sides rotating to manage promotion or relegation fatigue produce distinct card market movements, because fresher legs reduce reckless challenges yet increase tactical fouling when legs tire. Exchange liquidity spikes during these windows, and settlement data confirms that early rotation signals account for roughly 22 percent of total live volume in selected fixtures.
Conclusion
Links between squad rotation policies and live odds movements rest on measurable performance shifts during congested English football periods, with datasets confirming that substitution patterns and workload reductions produce predictable adjustments across goal, card, and possession markets. As calendars evolve, including pre-season blocks leading into July 2026 schedules, continued tracking of rotation metrics will keep providing clear signals for how in-play probabilities update in real time.